Site Selection and Soil Sampling: 14 lodgepole pine forest stands in Northwest Alberta disturbed by either harvesting (4), wildfire (3), MPB (3) or MPB and timber harvesting (4) were located and soil samples were collected from these stands. For each of the 14 disturbed sites, a control (paired) undisturbed lodgepole stand was also established and soil samples were collected from these stands (Images 5 and 6). For each site a grid was used to locate 25 points across the site where soil cores (25cm) were taken (Image 5). Lodgepole pine seeds were planted in 300ml of sterilized soil with the addition 17ml of homogenized soil collected from one of the 28 field sites which served as fungal inoculum for each pot (Karst et al. 2015). In the end a total of 280 pots were planted: 10 pots per site (Image 6). After seedlings were planted, pots were then placed in a greenhouse and grown for nine months.
Image 5 (Below): Location of 28 sites sampled across northwest Alberta. At each site a grid was used to sample 25 five soil cores each core was taken 7.5 meters away from each other.
Image 5 (Below): Location of 28 sites sampled across northwest Alberta. At each site a grid was used to sample 25 five soil cores each core was taken 7.5 meters away from each other.
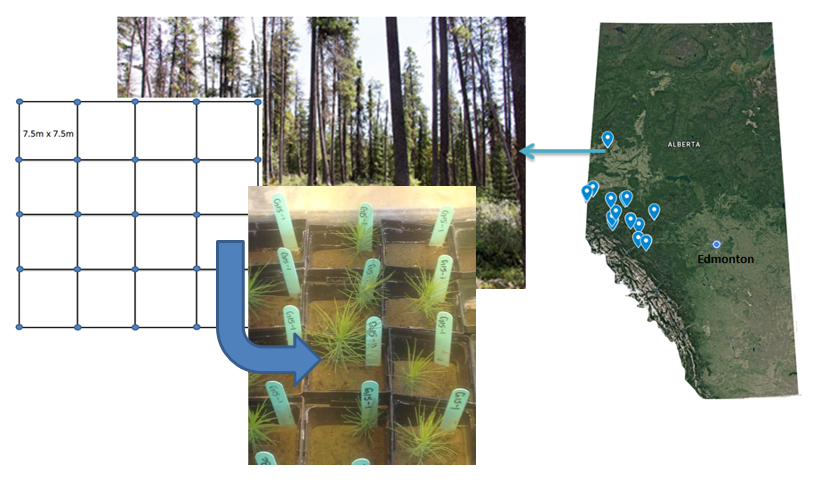
Image 6 (Below Right): This image is a graphical breakdown of how seedlings and pots were organized for this study. Image: 7 (Below Left): Lodgepole pine seedlings growing in the greenhouse.

|

|

Seedling Performance: Height was determined by measuring the seedlings from the root collar to the tip of the apical meristem. In order to measure biomass, the above and below ground tissue of harvested seedlings will be dried (Cigan et al. 2015). The weight of freeze dried roots tips sampled for carbon allocation measurements was then added to the weight of harvested seedlings. The total weight of dried tissue and root tips was used as a measure of below and above ground biomass. In addition, dried foliar tissue from the seedlings used for the biomass measurements was sampled and analyzed in order to determine macro nutrient composition of the seedlings.
Carbon allocation: DNA stable isotope probing techniques were used to determine how seedlings allocate carbon to soil fungal functional groups (i.e. ectomycorrhizal, saprotrophic and phytopathogenic). Seedlings were placed in gas tight growth chambers and exposed to 3.2 mmol of 13CO2. For three days seedlings photosynthesized and created sugars containing labeled carbon (Image 8). During the three day period labeled sugar was either consumed ECM as part of the seedling- fungal symbioses or consumed by phytopathogenic or saprotropic fungi as they digested seedling tissue. As a result of the consumption of this labeled carbon it becomes possible to identify fungal OTUs directly interacting with the seedling being studied. After three days of exposure to labeled carbon, seedlings were harvested and fungal DNA extracted from both the root tips and soil samples. Since DNA with 13C is heavier than 12C DNA, we were able to separate the labeled DNA of fungi that directly interacting with seedlings from fungi not directly interacting with seedlings (Neufeld et al. 2007).
Image 8 (Below): Pictorial representation of the assimilation of 13co2 by the seedlings and the translocation of that carbon to soil fungi during the three day chase period.
Image 8 (Below): Pictorial representation of the assimilation of 13co2 by the seedlings and the translocation of that carbon to soil fungi during the three day chase period.

Analysis: In order to determine if there is a significant difference between fungal inoculum treatments for the seedling performance and carbon allocation variables an MANOVA test was used. If the results of the MANOVA are significant then I will follow up this test with a uni-variate ANOVA test for every variable. MANOVA tests are much like an ANOVA test in that they compare the distance within each group (noise) to the separation between groups (signal) to calculate significance. But unlike an ANOVA test the MANOVA calculation factors in the cross-products matrix into the calculation not just the sum of squares.
NMDS ordinations will be used to help reduce the complexity of my data and visualize fungal inoculum treatment trends. In addition, these ordinations will allow me to visualize relationships, in the form of vectors, between inoculum treatment and individual carbon allocation and seedling performance variables. Bray-Curtis distance measure will be used to calculate the distance matrices needed to complete the ordination. NMDS ordinations can use a variety of distance matrices to ordinate data and are used reduce the complexity of large data sets. The meta NMDS function runs NMDS ordinations several times to identify stable configurations. The resulting meta NMDS ordination will not vary every time you run the ordination unlike a regular NMDS.
I will used a heatmap to help visualize trends fungal OTU data for the different disturbance treatments. Like NMDS ordinations, heatmaps are a way to visualize your data and identify patterns that exist in the data. Heatmaps are constructed by creating a scaled matrix using the vectors of interest. Color gradients are then used in conjunction with the scaled matrix to help visualize trends.
CANCOR constrained gradient analysis will be used to identify correlations that exist between fungal OTU data and the seedling performance data. The purpose of this analysis will be to determine if there are any individual fungal OTUs that are correlated with either increased or decreased seedling performance. CANCOR constrained gradient analysis is a rotation based multivariate technique used to identify correlations between two data sets. The CANCOR analysis works by rotating two data sets to maximize the correlations for each canonical function.
Images Cited:
- Image: courtesy of Jon Cale and Jean Carlo Rodriguez Ramos
- Image: https://commons.wikimedia.org/w/index.php?curid=2391233
- Image: http://www.nature.com/nature/journal/v388/n6642/fig_tab/388517a0_F1.html
