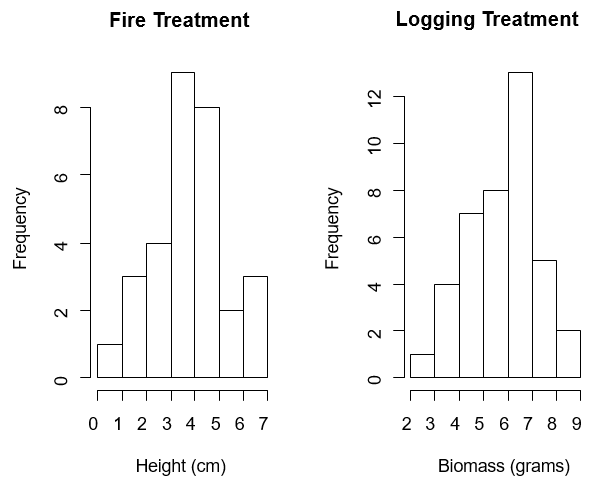
Data Exploration: Boxplots and histograms were initially used to help identify possible errors in the data. Data points were only considered to be errors if the values far exceeded the normal expected range of the data. Boxplots were also used to help visualized the distribution of the data by disturbance treatment for Height (Figure 3), biomass (Figure 3), foliar macronutrient content (Figure 4) and fungal OTU composition. In addition, residual plots and histograms were also used for all variables to help determine if the distribution of the data was normal and if the data had equal variances, both assumptions for MANOVA, one-way ANOVA and CANCOR analysis (figure 1,2).
Figure 1 (Right): Two examples of histograms made for each treatment and variable in order to view the distribution of the data. Figure 2 (Left): Residuals plot used to view the distribution and variance of the data.
|

|
Since the data met the assumptions, a MANOVA test was used to investigate the research objective and explore if there were significant difference (Alpha level= 0.05) as a result of control and disturbance treatment for height, biomass, nutrient composition and allocation of carbon to fungal OTUs. The results of the MANOVA test indicated that the effect of the disturbance treatment were significant (P-value<0.00001). Since the result of the MANOVA test was significant, one-way ANOVA tests were used to follow up on the significant MANOVA test result.
One-way ANOVA test was used to investigate the if the five disturbance treatments had significant effects (Alpha level=0.05) on seedling height, biomass, foliar nutrient content and fungal OTU composition. The results of the one-way ANOVA test indicated that seedling height (P-value > 0.05 ) was not significantly different among disturbance treatments, whereas biomass (P-value<0.00001) differed significantly among disturbance treatments (Figure 3). Seedling height may have not been significant among disturbance treatments because seedlings were spaced in a way that there was no competition for light resources. In order to investigate the relationship of seedling biomass as a result of disturbance treatment Tukey adjusted pairwise comparisons were made among all the treatments (Figure 3, Table 1).

Figure 3 (Right): Boxplots of Height in Centimeterss and Biomass in Grams for the control and four disturbance treatments. The results of the Turkey adjusted pairwise comparisons are indicated in the biomass boxplot.
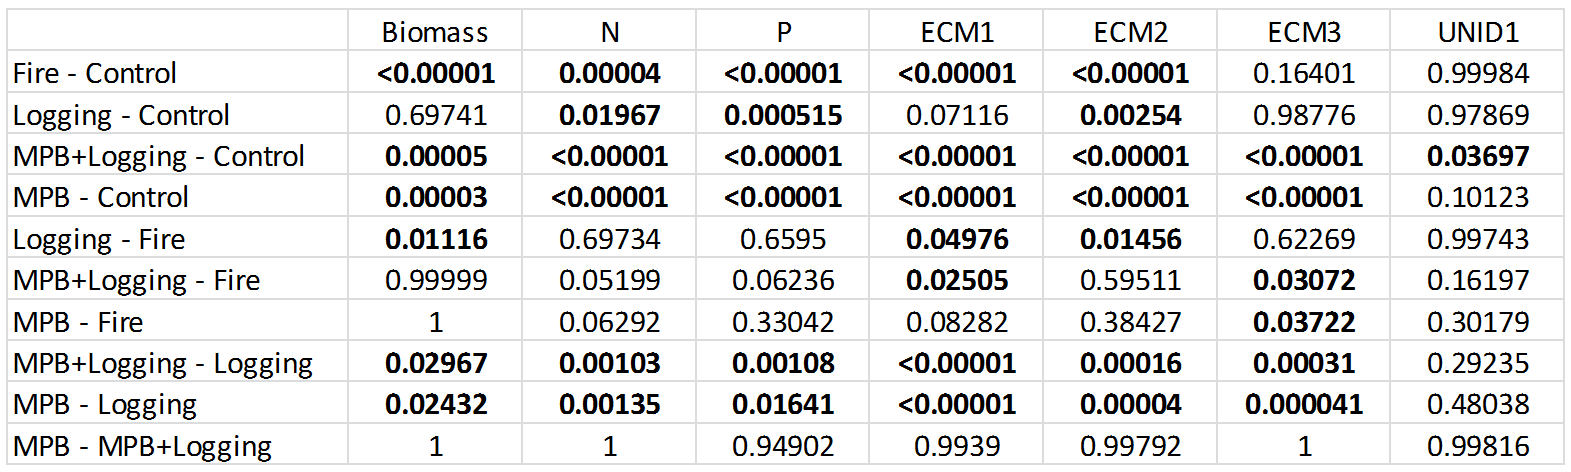
Table 1 (Below): A table of the Tukey adjusted P-values from pairwise comparisons of control and four disturbance treatment are shown below for Biomass, Nitrogen, Phosphorus, ECM1, ECM2, ECM3 and UNID1. Significant Tukey adjusted P-values are indicated in bold.
Like the biomass and height data one-way ANOVA tests were used to determine if there were significant differences in the composition of the seedling macronutrients Nitrogen, Potassium, Phosphorus, Magnesium and Calcium as a result of disturbance treatment. The results of the one-way ANOVA tests indicated that there was not significant differences (P-value > 0.05) in the concentrations of Magnesium , Potassium and Calcium as a result of disturbance treatment. However, disturbance treatment was significant for both Nitrogen (P-value<0.00001) and Phosphorus (P-value< 0.00001). Nitrogen and phosphorus were likely significantly because those two nutrients are commonly limit plant growth whereas Magnesium, Potassium and Calcium rarely limit plant growth. Tukey adjusted pairwise comparisons were made to enable a comparison of nitrogen levels for all disturbance treatments (Figure4, Table 1) and phosphorus levels for all disturbance treatments (Figure 4, Table 1).

Figure 4 (Above): Boxplot of percent seedling dry weight for the nutrients Ca, K, MG, N and P. Significant differences among disturbance treatments using one-way ANOVA are indicated in bold for Nirtrogen and Phosphorus. The follow-up results of the one-way ANOVA are also indicated on the boxplots.
Lastly, a one-way ANOVA test was used to indicate if there were significant differences among disturbance treatments and the percent of specific fungal OTUs receiving carbon from seedlings. The one-way ANOVA tests indicated that as a result of disturbance treatment seedlings allocated carbon significantly different to ECM1 (P-value<0.000001), ECM2 (P-value<0.000001), ECM3 (P-value<0.000001), and UNID1 (P-value=.01393) but the effect of disturbance treatment was not significant on PATH, SAP, and UNID2 (P-value's>0.05). Tukey adjusted pairwise comparisons were made to compare the levels of ECM1, ECM2, ECM3 and UNID1 among all disturbance treatments (Figure 5, Table1). These findings indicate that different disturbance treatments have a significant impact on how seedlings allocate carbon to fungal OTUs.

Figure 5 (Right): Bargraph of percent of the seven fungal OTUs that received carbon from seedlings. Significant differences in Percent Fungal OTUs as a result of disturbance treatment are indicated in bold. Results of the Tukey adjusted Pairwise comparisons for ECM1. ECM2, ECM3 and UNID1 are indicated on the graph.
